More


 Monitoring State environmental monitoring Monitoring of water bodies State of shores and bottom of water bodies 2019 data
Results of observations of the shores and bottom state in 2019
Two types of pictograms are used to reflect the measured rate of change in the shoreline and change the topography of the bottom of water bodies.
When hovering of the cursor on the icon, a window will appear, that shows the name of the water body, the observation point and the rate of change of the coastline or bottom relief according to data of 2019.
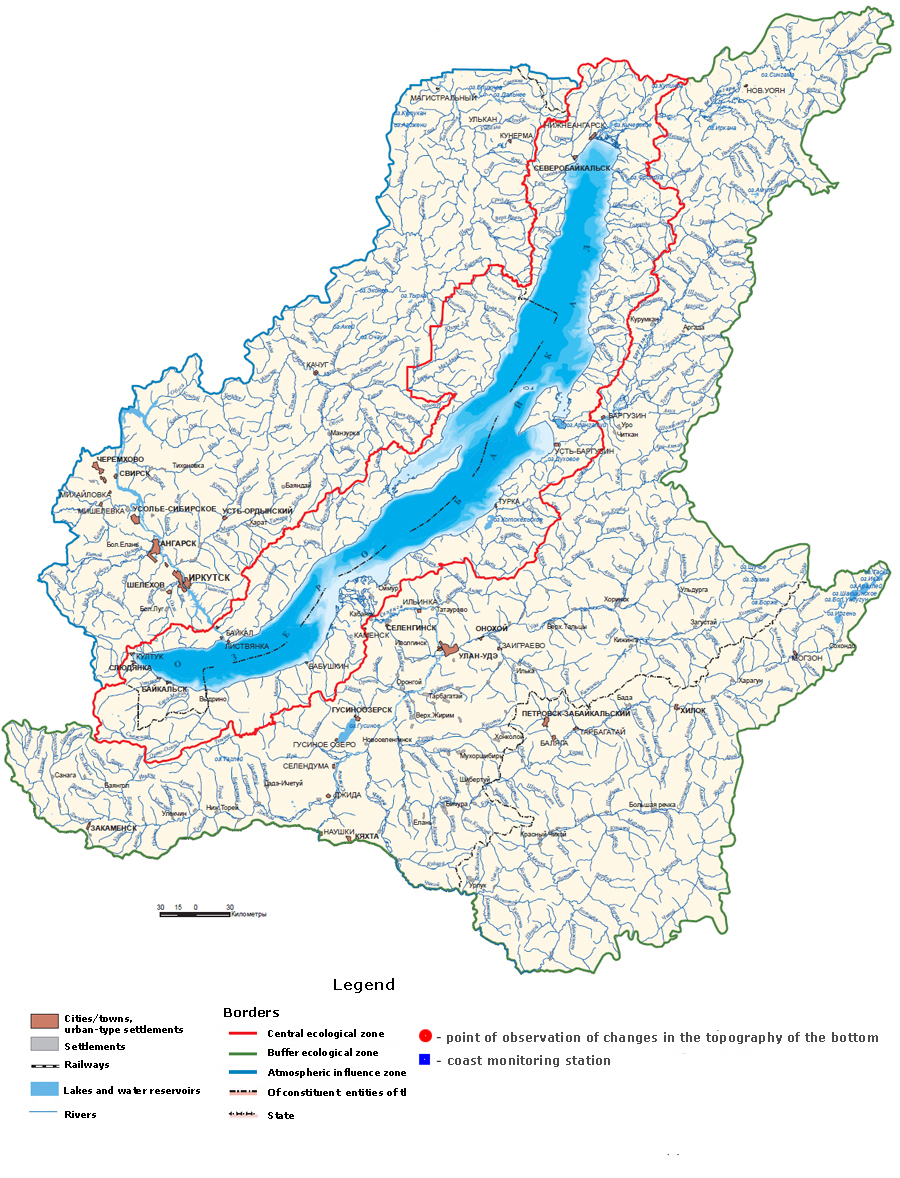
For more information on abrasion of the shores of lakes and coastal erosion of rivers in 2019, see the page "Exogenous geological processes" of this site.
In 2024, the Baikal Mile will be held from 6 to 8 June.
Taking part in the Baikal Mile is a great way to test your limits of possibilities and feel the breath of nature in one of the most beautiful places on earth.
In 2024, the festival of ice sculptures on Lake Baikal is scheduled for the period from February 15 to 28. During these two weeks, the lake shore will turn into a real open-air museum, where everyone will be able to enjoy sculptural masterpieces created from ice.


The portal has been created for FSBI ”Informational and Analytical Center for Development of Water Bodies and Associated Properties” under the special program “Protection of Lake Baikal and Socio-Economic Development of the Baikal Natural Preserve for 2012-2020.”


